Demonstrating an approach for evaluating synthetic geospatial and temporal epidemiologic data utility: results from analyzing >1.8 million SARS-CoV-2 tests in the United States National COVID Cohort Collaborative (N3C)

Abstract
Objective: To evaluate whether synthetic data derived from a national coronavirus disease 2019 (COVID-19) dataset could be used for geospatial and temporal epidemic analyses.
Materials and Methods: Using an original dataset (n = 1 854 968 severe acute respiratory syndrome coronavirus 2 tests) and its synthetic derivative, we compared key indicators of COVID-19 community spread through analysis of aggregate and zip code-level epidemic curves, patient characteristics and outcomes, distribution of tests by zip code, and indicator counts stratified by month and zip code. Similarity between the data was statistically and qualitatively evaluated.
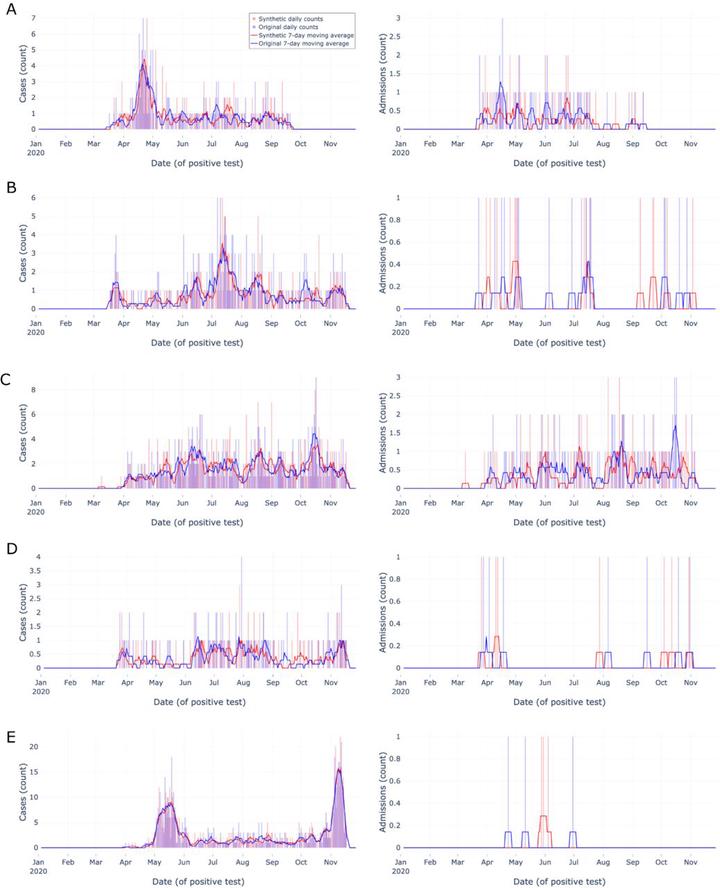
Results: In general, synthetic data closely matched original data for epidemic curves, patient characteristics, and outcomes. Synthetic data suppressed labels of zip codes with few total tests (mean = 2.9 ± 2.4; max = 16 tests; 66% reduction of unique zip codes). Epidemic curves and monthly indicator counts were similar between synthetic and original data in a random sample of the most tested (top 1%; n = 171) and for all unsuppressed zip codes (n = 5819), respectively. In small sample sizes, synthetic data utility was notably decreased.
Discussion Analyses on the population-level and of densely tested zip codes (which contained most of the data) were similar between original and synthetically derived datasets. Analyses of sparsely tested populations were less similar and had more data suppression.
Conclusion: In general, synthetic data were successfully used to analyze geospatial and temporal trends. Analyses using small sample sizes or populations were limited, in part due to purposeful data label suppression—an attribute disclosure countermeasure. Users should consider data fitness for use in these cases.